")
Hey all, recently we had a very interesting one-time project going on, and we wanted to share the surprising results of fixing the Core Web Vaitals issues we’ve discovered. We’ll start with a short introduction about the company and its SEO state before we started working on the project (spoiler alert: its SEO quality was actually very good).
About The Client Company
The company we are speaking about is relatively new (operating for 2.5 years) but already a very successful one in the cybersecurity industry. Its products are aimed at business owners that deal with big transfers of data, so we can say that its main focus is B2B. From the first moment that we saw the website of the company, it was clear that it was built with a serious focus on maximizing conversions, even a bit too much of that focus.
Its on-page SEO quality was very high; we saw a bunch of relevant internal links, titles and meta descriptions on point, no canonical issues whatsoever, fully optimized images, relevant schemas, and a correct heading hierarchy. We can say that we didn’t like the link profile it had, containing lots of farm domains and manipulated DR ones, but it wasn’t at such a scale that would affect its SEO results negatively (we don’t know at this point at least).
After we got access to GSC, we were kinda shocked. We saw that the website rankings dropped significantly 3 months ago and the clicks graph looked more like a graveyard.

Not sure what SEO is? Read all about it here
Finding the Problem – Discovery is the First Step
To understand the problem better, we decided to use a tool by Google called PageSpeed Insights. This tool helps us see all the performance issues of a website and offers tips on how to fix them. We used it on each page of the company website, and it helped us find several issues.
Note: We recommend using all of these tools for more accurate results from your performance analysis:
- Pingdom – Very easy-to-understand reports, highlighting all stages of a request in different colors, allowing you to conduct the speed test from several geo-locations.
- GTMetrix – Uses a simple grading system. You got an A? GG! If you want to change the geolocation from which the test is made, you’ll need to register.
- PageSpeed Insights – The holy grail if you ask me, provided by Google itself. In addition to highlighting all the performance issues both on mobile and desktop, you get an analysis of best practices, accessibility, and SEO.
Issue #1 – High LCP
The first problem was that the website was taking too long to load. This was measured by something called Largest Contentful Paint (LCP). In simple terms, LCP is the time it takes for the biggest piece of content on the screen to fully load. For this company, the problem was that their website had lots of high-quality images and scripts which were slowing things down.
We didn’t expect the LCP to be over 5.5s on mobile (see screenshot below).

Issue #2 – High CLS
The 2nd problem we identified was an issue known as Cumulative Layout Shift (CLS). This is a measure of how many elements on a page move around while the page is loading. If things shift around too much, it can make the website frustrating to use because it could cause users to click on the wrong thing or lose their place while reading. While we conducted the initial test on PageSpeed Insights, the CLS was 0.13.
Several factors contributed to the high CLS on their website:
- Fonts – The custom web fonts that the company used for branding purposes were significantly affecting the site’s CLS. When a user first visited the site, the text would initially display in a default system font. But as soon as the custom fonts finished loading, the text would abruptly switch over, causing a noticeable shift in the layout.
- Dynamic content – Their website featured various forms of dynamic content that were added to the page after the initial load. For instance, user comments on blog posts and real-time updates on cybersecurity threats were all added to the page after it first loaded. This additional content often resulted in other elements on the page being pushed down or to the side, causing a jarring shift in the layout.
- Images – They were not always specifying the dimensions of their images. As a result, the rest of the content was often loaded before the images, and once the images did load, they would push down the rest of the content, leading to an unstable layout.
To sum up, the high CLS on their website was a combination of factors involving font loading, dynamic content, and unsized images, each contributing to an unstable page layout and a less-than-ideal user experience.
Issue #3 – High TTFB (Time to First Byte)
The 3rd problem we noticed was the website’s Time to First Byte (TTFB). TTFB is a measurement of how long it takes for a user’s browser to receive the first byte of data back from the server after sending a request. In this case, the TTFB was too high, indicating that the server was taking too long to respond to requests (probably, there could be other factors like themes or plugins since the website is using WordPress).
This issue is usually one of the easiest to fix.

Solving the Problems: Improving Core Web Vitals
Now that we’ve finished our initial audit and come up with several issues that could be causing the drop in rankings, we started working on the solutions.
Solution #1 – Improving the LCP
The high LCP was a significant issue affecting the website performance. To bring it down to an acceptable range, we had to optimize their high-quality images and scripts, which were contributing the most to the load times.
Optimizing Images
The company had a lot of high-quality images on their website. While these images were visually impressive, they were also large in size and took a long time to load, impacting the LCP.
Our first step was to use modern, efficient formats for these images. We converted them to WebP using Pixlr, which provides superior lossless and lossy compression for images on the web. WebP images are smaller in size than PNG or JPEG, so they load faster, improving LCP times.
Next, we implemented lazy loading for images using WP Rocket. Lazy loading is a technique where you delay the loading of images that are off-screen; they’re only loaded when the user scrolls down to them. This way, the browser doesn’t waste time loading images the user can’t see yet, allowing it to focus on loading the images currently in view more quickly.

Optimizing Scripts
JS scripts were another major factor affecting the LCP. JavaScript is often used to add interactivity and other features to a website, but if not managed carefully, it can slow down page load times.
Firstly, we minified all the script files, which reduced the file size and thus the download time.
Then, we implemented a practice called “script deferment”. By default, the browser will stop “building” the page whenever it encounters a script. Deferring a script tells the browser to continue rendering the page and to execute the script after it finishes. This allows the main content of the page to load quickly without waiting for all the scripts to load first, thus improving LCP.
Finally, we audited the scripts running on the website and found some that were no longer necessary or could be replaced with more efficient alternatives. Removing or replacing these further improved the load time.

Results
By implementing these changes, we were able to reduce the website’s LCP from over 13 seconds on mobile to under 2.5 seconds, a significant improvement. This led to a better user experience and had a positive impact on the website’s SEO performance (which we’ll see soon), as site speed is a key factor in Google’s ranking algorithm.
Solution #2 – Reducing the CLS
After identifying the issues contributing to high Cumulative Layout Shift (CLS), we started planning with the customer what kind of changes can be made, and which ones could be problematic. Those are the solutions and changes that the customer was okay with.
Stabilizing Font Loading
The first issue was the CLS caused by the loading of custom web fonts. To address this, we utilized a CSS feature called font-display. When we set font-display to swap, it meant that the browser would initially display the text in a system font, but switch to the website’s custom font as soon as it finished loading.
The ‘swap’ feature mitigates layout shifting because the text size and spacing won’t change much between the two fonts. This is quite easy to do, so you can give it a try yourself.
Code example:
@font-face {
  font-family: 'CyberSecurityFont'; /* Setting a unique name for the custom font */
  src:  url('cyberfont.woff2') format('woff2'),
        url('cyberfont.woff') format('woff'); /* Specifying where to fetch the font files */
  font-display: swap; /* Applying a rule to use system font until custom font loads */
}
Organizing Dynamic Content
Next, we addressed the CLS resulting from the website’s dynamic content. The unpredictable nature of the loading of this content was causing layout instability, which we resolved by reserving “real estate” space for it.
We implemented skeleton screens – meaning, some placeholder content that appears while the real content is loading. This method reserves the necessary space on the page and assures that other content won’t get pushed around, even if the dynamic content loads late. Pretty cool, right?
Optimizing Image Loading
This one is my favorite!
The final factor contributing to the high CLS was the late-loading images that were pushing the content around (a very common issue). To fix this, we made sure to specify dimensions (height and width) for every image on the website.
Doing so meant the browser could allocate the appropriate space for the image before it loaded, ensuring the rest of the content wouldn’t be affected once the image was fully loaded.
Tip: You can use WP Rocket to specify missing image dimensions automatically.
HTML example:
<img src="https://rndmrkt.com/example-image.webp" alt="This is an example image"
 width="1920" height="1080">
In addition, we started using an image loading technique called ‘lazy loading’ for images further down the page. This technique loads images as the user scrolls down, rather than loading them all when the page first opens, reducing the loading burden at the start and making the layout more stable.
Results
By addressing all these issues one by one, we managed to drastically reduce the CLS on the website to 0 and avoid annoying layout shifts that in addition to offering a bad user experience, caused a fail in the Core Web Vitals.

Solution #3 – Improving Server Response Time
The primary solution to high Time to First Byte (TTFB) involved improvements to both the server infrastructure and network delivery. In some cases, especially for websites using WordPress as CMS, themes and plugins can cause a high TTFB too; luckily it wasn’t the case here.
Here’s how we addressed these issues:
Migrating to a Better Hosting Provider
The first step in addressing the server-side factors contributing to the high TTFB was examining the hosting provider. Sometimes, shared hosting solutions can result in slower server response times due to the number of websites hosted on the same server.
After evaluating their hosting situation, we decided that a migration to a dedicated hosting server was required. dedicated hosting offers several advantages, including faster server response times, as the resources are not shared with other websites.
We assisted them in choosing a reliable dedicated hosting provider known for excellent server performance and ensured a smooth migration process named Contabo, and their Sysadmin took care of the migration itself.
Implementing a Content Delivery Network (CDN)
On the network side, we implemented a Content Delivery Network (CDN) to help reduce the physical distance between the user and the server, which can be a significant factor in high TTFB. For this project, we decided to use Cloudflare’s free plan.
CDNs cache the website’s content on servers all over the world. When a user requests the website, the CDN delivers the content from the closest server, effectively reducing network latency. This implementation ensured their global audience received data quickly, regardless of their location.
Results
These strategies allowed us to improve the TTFB, reducing it to 200ms only – an improvement of approximately 80%. The dedicated hosting and implementation of a CDN combined to make the website load much faster. This improved the user experience and also helped us to fix another Core Web Vitals issue.
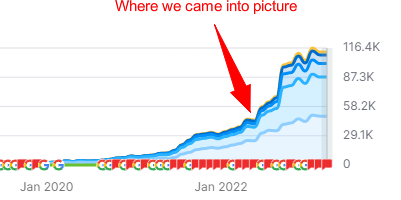
The Final Results: A Big SEO Boost
After we made these changes, the website started doing much better. Their Core Web Vitals scores improved a lot, with no failing scores at all, and as a result, their position in Google’s search results started to go up. See the screenshot below, taken from SEMrush.
Case Study Conclusion
Even when your on-page SEO is executed well, there are a lot of other factors you should think about. Some of those require a deep technical audit to be found. Let’s take a last look at this case study; even though they were doing everything else right, issues with their Core Web Vitals were holding them back. But once they fixed these issues, they saw a big improvement in their search rankings.
During that whole optimization period, we didn’t focus on off-page or on-page improvements at all, and this is how we know that solving the Core Web Vitals issues did the trick. If your time is limited or you don’t want to deal with all the techy fun, check out our SEO services and join the family!