Table of Contents
- Introduction
- Why Paid Ad Performance Matters More Than Ever
- Signal 1: Low Click-Through Rates (CTR)
- Signal 2: High Cost-Per-Click (CPC)
- Signal 3: Low Conversion Rates
- Signal 4: Poor Audience Targeting
- Signal 5: High Bounce Rates on Landing Pages
- Signal 6: Declining Return on Ad Spend (ROAS)
- Signal 7: Lack of Regular Campaign Audits
- How to Reset Your Paid Ad Campaigns: A Step-by-Step Guide
- Conclusion: Take Control of Your Paid Media Today
- FAQs
Introduction
Paid advertising can be a game-changer for businesses looking to drive traffic, generate leads, and boost sales. Whether you’re running campaigns on Google Ads or Meta platforms, the promise of instant visibility is alluring. But here’s the hard truth: not every campaign delivers the results you expect. In fact, many businesses unknowingly pour money into underperforming ads, missing out on potential revenue due to poor paid advertising strategy or misaligned tactics.
So, how do you know if your campaigns are working—or if they’re just burning through your budget? In this comprehensive guide, we’ll uncover seven clear signals that your paid media efforts need a reset. From low click-through rates to soaring costs per click, we’ll break down the warning signs and provide actionable steps to audit and optimize your campaigns. Whether you’re a small business owner managing in-house ads or a marketer pitching a campaign overhaul, this article—crafted by the strategic and ROI-minded team at RnD Marketing—will equip you with the tools to maximize your paid media ROI.

Why Paid Ad Performance Matters More Than Ever
In today’s digital landscape, paid ads are a cornerstone of modern marketing. Platforms like Google Ads and Meta Ads offer unparalleled reach, but they come with a price—both literal and strategic. A poorly optimized campaign can drain your budget without delivering meaningful results, while a well-tuned one can yield impressive returns. Conducting a regular PPC audit is crucial to ensure your investment isn’t going to waste.
Before diving into the warning signs, remember that paid advertising isn’t a “set it and forget it” game. Algorithms change, audiences evolve, and competitors adapt. Staying ahead requires vigilance and a willingness to pivot when things aren’t working. Let’s explore the seven signals that scream, “It’s time for a campaign reset!”
Signal 1: Low Click-Through Rates (CTR)
What Is a Low CTR Telling You?
Your click-through rate (CTR) measures the percentage of people who click on your ad after seeing it. A low CTR often indicates that your ad isn’t resonating with your target audience. Perhaps your headline isn’t compelling, your visuals aren’t engaging, or your targeting is off. Regardless of the reason, a low CTR means fewer people are reaching your landing page—and that directly impacts your ad campaign performance.
Industry benchmarks for CTR vary by platform and sector, but if your Google Ads campaign is consistently below 2% or your Meta Ads hover under 1%, it’s time to investigate.
How to Fix It
- Refine Your Ad Copy: Test different headlines and descriptions to see what grabs attention. Use action-oriented language and address pain points.
- Enhance Visuals: For Meta Ads, high-quality images or videos can make a huge difference. Ensure they align with your brand and message.
- Adjust Targeting: Double-check your audience demographics, interests, and keywords. Are you reaching the right people?
For deeper insights, refer to Google’s official guide on improving CTR.
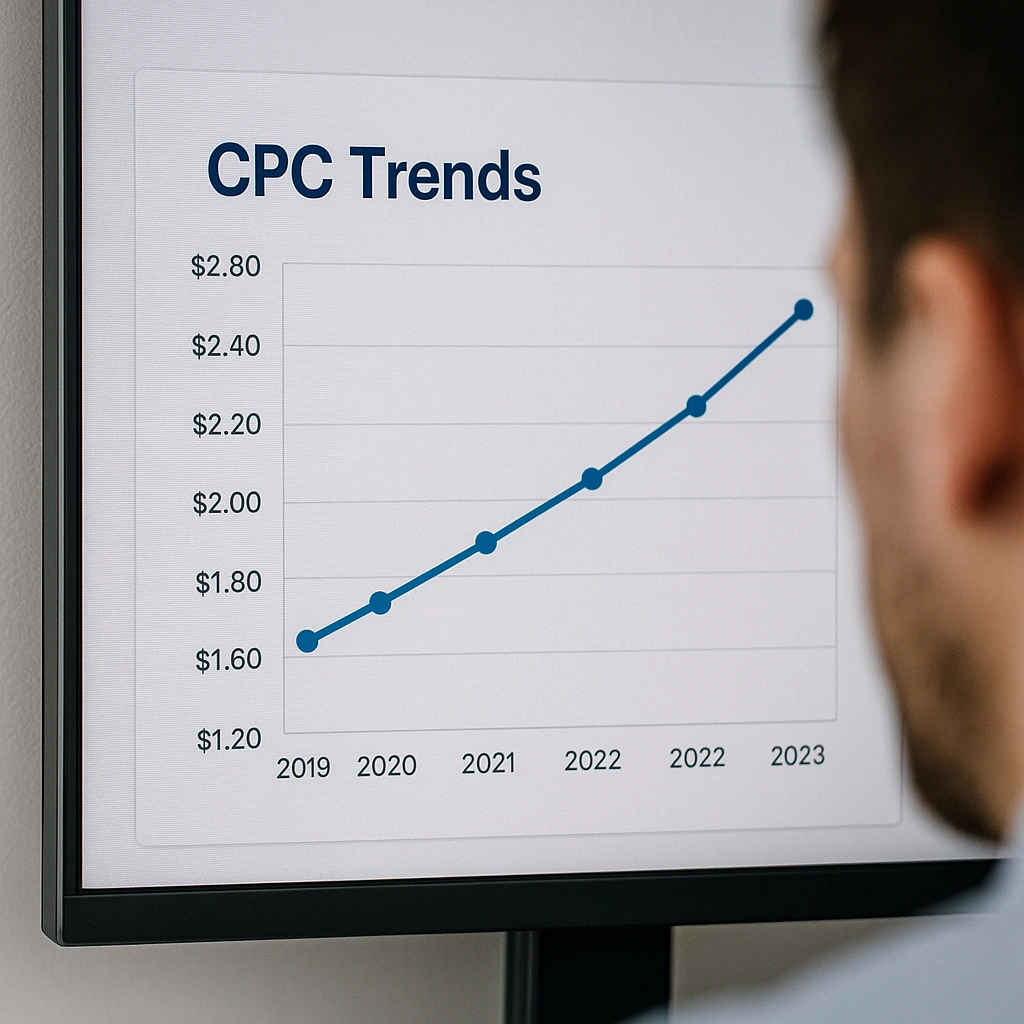
Signal 2: High Cost-Per-Click (CPC)
Why Are Your CPCs Skyrocketing?
A high cost-per-click (CPC) means you’re paying more than you should for each visitor to your site. This can happen due to intense competition for keywords, poor Quality Scores on Google Ads, or broad targeting that includes irrelevant audiences. If your CPC is eating into your budget without delivering results, it’s a red flag for Google Ads optimization.
Steps to Lower CPC
- Improve Quality Score: Focus on ad relevance, landing page experience, and expected CTR. A higher Quality Score can reduce CPC on Google Ads.
- Use Negative Keywords: Exclude irrelevant terms to avoid wasting clicks on unqualified traffic.
- Target Long-Tail Keywords: These are often less competitive and more cost-effective.
Signal 3: Low Conversion Rates
Are Clicks Turning Into Customers?
If people are clicking your ads but not converting—whether that’s making a purchase, signing up for a newsletter, or filling out a form—it’s a sign of a disconnect. Low conversion rates often point to issues beyond the ad itself, such as misaligned landing pages or unclear calls-to-action (CTAs).
Actionable Fixes
- Align Ads with Landing Pages: Ensure the messaging and design of your ad match the landing page. If someone clicks expecting a discount, deliver on that promise.
- Optimize CTAs: Make them clear and urgent. “Buy Now” or “Get a Free Quote” works better than vague phrases.
- Test User Experience: Is your page mobile-friendly? Does it load quickly? Use tools like Google’s PageSpeed Insights to check.
Signal 4: Poor Audience Targeting
Are You Reaching the Wrong People?
Even the best ad copy and visuals won’t work if they’re shown to the wrong audience. Poor targeting can lead to wasted impressions, low engagement, and minimal conversions. This often happens when campaigns rely on overly broad demographics or fail to use platform-specific tools for precision targeting.
How to Refine Targeting
| Platform | Targeting Tip |
|---|---|
| Google Ads | Leverage remarketing lists and in-market audiences to focus on users already interested in your offerings. |
| Meta Ads | Use detailed targeting options like interests, behaviors, and lookalike audiences to mirror your best customers. |
Regularly review audience insights to ensure your paid advertising strategy aligns with who’s actually converting.
Signal 5: High Bounce Rates on Landing Pages
Why Are Visitors Leaving So Quickly?
A high bounce rate means visitors are leaving your landing page almost immediately after arriving. This could signal poor design, slow loading times, or a mismatch between the ad’s promise and the page’s content. High bounce rates hurt your ad campaign performance and can negatively impact your ad rankings.
Steps to Reduce Bounce Rates
- Speed Up Load Times: Compress images and minimize scripts to ensure fast loading.
- Match Intent: If your ad promises a free trial, make sure the landing page prominently features that offer.
- Simplify Design: Avoid clutter. Focus on a single goal per page with clear navigation.

Signal 6: Declining Return on Ad Spend (ROAS)
Is Your Campaign Losing Profitability?
Return on Ad Spend (ROAS) measures how much revenue you earn for every dollar spent on ads. A declining ROAS indicates that your campaign’s efficiency is slipping, often due to rising costs, falling conversions, or market saturation. Tracking paid media ROI is critical to maintaining profitability.
How to Improve ROAS
- Reallocate Budget: Shift spend to high-performing campaigns or ad groups.
- Optimize Bidding Strategies: Experiment with automated bidding options like Target CPA or Maximize Conversions on Google Ads.
- Focus on High-Value Audiences: Prioritize segments with the highest conversion potential.
Signal 7: Lack of Regular Campaign Audits
Are You Neglecting Maintenance?
Even if your campaigns are performing decently, failing to conduct regular audits can lead to gradual declines. A PPC audit helps uncover hidden issues like wasted spend, outdated keywords, or missed opportunities. Without consistent check-ins, small problems can snowball into major losses.
Building a Routine Audit Checklist
- Review keyword performance and remove underperforming terms.
- Check ad relevance and update copy as needed.
- Analyze audience data to spot shifts in behavior or trends.
- Monitor competitor activity to stay competitive in bidding and messaging.
For a detailed audit template, explore resources like WordStream’s Google Ads Audit Guide.
How to Reset Your Paid Ad Campaigns: A Step-by-Step Guide
If you’ve identified one or more of the signals above, don’t panic. A campaign reset can breathe new life into your paid media efforts. Here’s a structured approach to get back on track with Google Ads optimization or Meta Ads tweaks:
- Pause Underperforming Ads: Stop the bleed by halting ads with low CTR, high CPC, or poor ROAS.
- Conduct a Full Audit: Dive into metrics like impressions, clicks, conversions, and spend. Use platform analytics or third-party tools for deeper insights.
- Revisit Goals: Are your campaigns aligned with current business objectives? Adjust KPIs if needed.
- Revamp Creative and Targeting: Refresh ad copy, visuals, and audience segments based on audit findings.
- Test and Iterate: Run A/B tests on new variations and monitor results closely over 1-2 weeks.
- Optimize Landing Pages: Ensure they’re user-friendly, relevant, and conversion-focused.
- Set a Review Schedule: Commit to weekly or bi-weekly check-ins to maintain performance.
Conclusion: Take Control of Your Paid Media Today
Paid advertising holds immense potential, but only if you’re proactive about monitoring and optimizing. The seven signals we’ve covered—low CTRs, high CPCs, poor conversions, inaccurate targeting, high bounce rates, declining ROAS, and neglected audits—are clear indicators that your campaigns need a reset. By addressing these issues head-on with a robust paid advertising strategy, you can transform wasted spend into measurable results.
At RnD Marketing, we believe that a strategic, ROI-focused approach is the key to unlocking the full power of paid media. Whether you’re fine-tuning in-house campaigns or seeking expert guidance, the time to act is now. The digital ad landscape will only grow more competitive, and staying ahead means constant evaluation and adaptation. So, take a hard look at your ad campaign performance today—are you truly getting the most from your investment?

FAQs
What is a good click-through rate (CTR) for different industries?
Click-through rates vary significantly across industries. For Google Search ads, the average CTR across all industries is approximately 3.17%, while for display ads it’s around 0.46%. E-commerce typically sees CTRs of 2.69% on search, while legal services often achieve higher rates near 3.6%. For Meta ads, the average CTR across industries is about 0.9%.
Healthcare and finance tend to have lower CTRs (1.79% and 2.41% respectively) due to compliance restrictions and customer research behaviors, while technology and B2B can reach 2.09-3.33% on search campaigns. If your campaigns consistently fall below these benchmarks, it’s a strong indicator your ads need optimization. For the most relevant comparison, benchmark against your specific industry rather than overall averages.
How often should I audit my paid advertising campaigns?
For optimal performance, you should conduct basic weekly reviews of key metrics like CTR, CPC, and conversion rates to spot immediate issues requiring attention. More comprehensive audits should be performed monthly, where you analyze audience behavior, keyword performance, and budget allocation across campaigns.
According to a 2023 survey by PPC Hero, companies that audit their campaigns monthly see an average of 18% higher ROAS than those conducting quarterly reviews.
Additionally, implement quarterly deep-dive audits to reassess your overall strategy, evaluate competitors, and make larger structural changes if needed. Certain events should also trigger immediate audits regardless of schedule: significant performance drops (10%+ decrease in conversions), major business changes, seasonal transitions, or after implementing new campaign elements. Research from WordStream found that advertisers who audit after performance drops recover 31% faster than those who wait for scheduled reviews.
What are the most effective ways to lower my cost-per-click (CPC)?
Several proven strategies can help reduce your CPCs while maintaining quality traffic:Improve Quality Score on Google Ads by enhancing ad relevance, landing page experience, and expected CTR. Data shows each point increase in Quality Score can lower CPCs by 5-13%, according to Google.Implement negative keywords rigorously—advertisers who add 30+ negative keywords typically see CPC reductions of 10-15% by preventing irrelevant clicks.Target long-tail keywords which are not only more specific but often 20-25% less expensive than broader terms while converting at 2.5x higher rates.
Adjust bid strategies by day-parting (scheduling ads during high-conversion hours) and geo-targeting to focus on locations with better performance, which can reduce CPCs by 7-12%.Experiment with ad extensions which increase ad real estate and can improve CTR by 10-15% without increasing costs, effectively lowering your CPC.Recent statistics show that advertisers implementing all these strategies together see an average CPC reduction of 18-24% within 60 days while maintaining or improving conversion volumes.
What’s a good ROAS benchmark for different industries?
Return on Ad Spend (ROAS) expectations vary substantially across industries due to differences in profit margins, conversion values, and customer lifetime value.E-commerce generally targets a ROAS of 4:1 (400%), meaning $4 earned for every $1 spent. High-ticket retailers often accept lower ratios of 3:1, while low-margin retailers may need 6:1 or higher to remain profitable.B2B companies typically work with ROAS targets of 3:1 to 5:1, but may accept lower immediate returns when factoring in long-term customer value.
Service industries see wide variation: legal services often achieve 4:1 to 8:1 ROAS due to high case values, while local services average 3:1 to 5:1.According to 2023 benchmark data from Nielsen, the average ROAS across all industries is approximately 2.87:1. However, top-performing campaigns (top 25%) consistently achieve 5:1 or higher.Rather than fixating solely on industry averages, calculate your minimum acceptable ROAS based on your profit margins, overhead costs, and business goals. A sustainable ROAS should at minimum cover your product/service costs, advertising spend, and contribute to overhead.
What metrics should I prioritize when measuring paid ad campaign success?
To determine if your landing page is undermining otherwise effective ads, look for these diagnostic patterns:High CTR paired with high bounce rates (over 70%) strongly suggests people like your ad but are disappointed by the landing page. According to CXL Institute research, this disconnect accounts for 43% of campaign failures.Check time-on-page metrics—if visitors spend less than 15 seconds on your landing page (the average is 54 seconds for converting pages), they’re likely not finding what they expected.Analyze device-specific conversion rates. If mobile conversions are significantly lower than desktop (more than a 40% difference), your landing page likely has mobile usability issues.
Use heat mapping tools like Hotjar or Crazy Egg to see where visitors actually click versus where your CTA buttons are placed. Misalignment here indicates user experience problems.Set up exit-intent surveys asking why visitors are leaving without converting—direct feedback often reveals issues not visible in analytics.Compare conversion rates across different traffic sources. If paid traffic converts at rates below 25-30% of your organic traffic conversion rate, your landing page isn’t matching ad expectations.For definitive testing, try sending ad traffic to different landing pages while keeping the ad constant, or use Google Optimize to A/B test landing page elements while maintaining the same traffic source.
What metrics should I prioritize when measuring paid ad campaign success?
While there are dozens of metrics available, focus on these core KPIs for meaningful measurement of paid ad effectiveness:Return on Ad Spend (ROAS) or Return on Investment (ROI) should be your north star metric, as it directly ties spending to revenue. The average cross-industry ROAS is 2.87:1, but your target should align with profit margins and business goals.Conversion Rate measures the percentage of clicks that result in desired actions. The average across industries is 3.75% for search ads, but this varies significantly by sector.Cost Per Acquisition (CPA) tracks how much you spend to acquire each customer or lead.
According to WordStream, the average CPA across Google Ads is $48.96 for search and $75.51 for display.Customer Lifetime Value to Customer Acquisition Cost ratio (CLV:CAC) provides a longer-term view of campaign efficiency. Harvard Business Review research suggests maintaining a ratio of at least 3:1 for sustainable growth.Attribution-adjusted metrics that consider the customer journey (first-click, last-click, or multi-touch) offer more nuanced insights than single-touch measurements. Google data shows that campaigns optimized with attribution models achieve 30% better performance on average.Secondary supporting metrics should include click-through rate, quality score, and engagement metrics, but these should inform optimization rather than define success. Always tie metrics back to business objectives rather than industry benchmarks alone.
How can I identify which specific keywords or audience segments are wasting my budget?
To identify budget-draining keywords and audience segments, implement these data-driven approaches:Conduct a cost-per-conversion analysis for all keywords and audience segments. According to WordStream, keywords with costs per conversion exceeding 150% of your target CPA are clear candidates for optimization or removal.Examine conversion windows—keywords that haven’t converted within 2-3x your average sales cycle length (with sufficient clicks) are likely underperformers. Research shows 90% of eventual conversions happen within this timeframe.Implement impression share monitoring to identify keywords consuming large portions of budget without proportional returns.
Google Ads benchmarks suggest keywords using more than 15% of your budget should generate at least 15% of conversions.Use assisted conversion reports in Google Analytics to identify keywords that may not drive direct conversions but contribute to the conversion path. Search Engine Journal reports that 20-60% of keywords may provide value beyond last-click attribution.For audience segments, analyze not just conversion rates but also post-click behavior metrics like pages per session and average session duration. Segments with high bounce rates (70%+) and low engagement are typically poor performers.Apply dayparting analysis—segments or keywords that perform well during business hours but poorly on evenings/weekends (or vice versa) should have scheduling adjustments rather than being paused entirely.Use Google’s or Meta’s AI-driven optimization tools, which can automatically identify underperforming areas. Recent studies show these tools can reduce wasted ad spend by 20-30% compared to manual optimization alone.